Earth Observations for medicanes science
Understanding Medicanes Through Satellite data
The MEDICANES project comprehensively makes a survey of all satellite observations and products available of key sea surface and atmospheric variables for EO-based medicanes characterization, for process understanding and improved forecast and for impact assessment in the realms of atmosphere and ocean. The survey is the reference for the satellite data collection and for building the first Medicane Atlas as well as for the development of new products and tools for Medicanes’ analysis and monitoring. Both LEO (Low Earth Orbit) and GEO (geostationary orbit) satellite observations are considered, as well as both operational and scientific missions.
Satellite observations and products of key sea surface, sea state, and atmospheric variables for medicanes’ characterisation and monitoring are considered in this project. The main aim is the exploitation of the EO data to detect and characterize the primary features identifying a medicane (i.e., warm core, almost-cloudless closed eye and nearly closed ring wind field). In addition, sea surface wind, sea surface temperature (SST), sea surface salinity (SSS), Sea Level Anomaly (SLA), atmospheric water vapour and temperature field, cloud properties (cloud top height, ice water path), deep convection diagnostics, and precipitation pattern and intensity are characterised as well.
 Example of a) WC’s vertical cross-section for medicane Zorbas, 29 Oct. 2018, b) almost-cloudless eye occurring during the medicane Numa, 18 Nov. 2017 and c) near-surface wind field for medicane Apollo, 29 Oct. 2021.
Microwave (MW) Radiometry for warm core and cloud properties diagnostics
Temperature sounding channels of PMW (passive microwave) radiometers onboard LEO satellites are used for warm core (WC) detection and characterization (depth, size and intensity) over the MEDICANES climatology time frame (2000-2020) and for the analysed cases. In analogy to what is done for tropical cyclones, three channels in the 50-60 GHz oxygen absorption band (i.e., 54.4, 54.94 and 55.5 GHz) are used to this end (Panegrossi et al, 2023). Within the MEDICANES project, the possible use of the 53.56 GHz channels to infer the presence of the WC in a lower tropospheric layer has been investigated. The brightness temperature (TB) provided by these channels are close to the air temperature at different pressure levels (from about 600 hPa for 53.596 GHz to about 200 hPa for the 55.5 GHz channel) since they are not (or very slightly) affected by the presence of cloud and precipitation particles.
 Example of a) 3D structure of WC for medicane Ianos, 17 Sep. 2020, b) top-bottom (baroclinic) WC from vertical cross section for medicane Apollo, 26 Oct. 2021 and c) bottom-top (barotropic) WC from vertical cross section for medicane Apollo, 29 Oct. 2021.
The radiometers employed for the WC detection are (in chronological order of their appearance) the Special Sensor Microwave - Imager/Sounder (SSMIS), the Advanced Microwave Sounding Unit (AMSU) and the Advanced Technology Microwave Sounder (ATMS). The WC is a warm anomaly region (corresponding to positive TB anomaly regions) extending from middle to upper troposphere at the storm center. The extension and the intensity of the TB anomaly provide an indication of the size and the strength of the WC. Usually, the TB anomaly within a medicane’s WC does not exceed 2 K and 100 km radius, while values up to 10 K and few hundred kilometers, respectively, are registered for TCs. Other than the detection, the origin of the WC can be addressed by PMW data (Di Francesca et al., 2025). In fact, the WC can have both a barotropic (i.e., when it has a bottom-top development and it is sustained by air-sea latent heat exchange) or a baroclinic (i.e., when it has a top-bottom development and it results from processes like stratospheric warm air intrusion) origin. In the former case, it often shows a vertical alignment across the different pressure levels, in the latter case it generally evidences a funnel-shape with a larger warm area in the upper than in the middle troposphere.
On the other hand, the PMW high frequency channels (≥89 GHz) can be used for cloud and precipitation structure diagnostics (e.g., cloud symmetry and rainband organization around the cyclone centre), for precipitation processes diagnostics (e.g., deep convection, warm rain processes) and for the development of the algorithm of the detection of the closed eye of medicanes. The high frequency channels are sensitive to the scattering of the ice particles (the higher the frequency the smaller the particle's size providing scattering signal). The combination of the signal provided by three channels in the 183 GHz band is used to detect the deep convective (DC) areas. The DC is an important feature to identify because it is a proxy favouring the air-sea latent heat exchange that, in turn, develops and sustains a barotropic WC. In addition, different tools exploit the PMW high frequency channels to estimate parameters characterising the cloud and precipitation structure of a medicane. Among these, DEEPSTORM (DEEP moiSt aTmospheric cOnvection from micRowave radiometer) algorithm is based on a machine learning to retrieve cloud top height (CTH), ice water path (IWP) and DC. The CTH can be used to identify the presence of the cloud-free eye occurring in the mature stage of a medicane’s lifetime other than characterize the cloudy structure of the cyclone.
 Example of a) CTH product, b) IWP product, c) TB183±7 GHz and d) TB difference between TB183±3 and TB183±7 GHz channels for medicane Ianos, 17 Sep. 2020.
The PMW-based diagnostic is a powerful tool to characterise both the thermodynamic (i.e. the warm core) and the microphysical (i.e. cloud and precipitation) structure of a medicane. This means that we are able to follow the medicane’s evolution from the development through the mature until the dissipation stage. However, the low spatial resolution of MW instruments can limit the correct identification of the main features characterising a medicane (e.g., the warm core’s size can be sometimes smaller than the instruments’ spatial resolution). At the same time, the temporal sampling is limited by the revisiting time typical of a LEO satellite (e.g., for the Mediterranean area a given region is overpassed two times per day on average).
Tracking of Medicanes and upper troposphere water vapour diagnostics
If on the one hand, we have seen that the PMW can characterise different aspect of a medicane (even analysing its structure in depth), on the other the monitoring of these events is allowed only at discrete time steps (e.g., few hours between two following observations). This gap can be filled by observations from geostationary (GEO) satellites. VIS/IR (visible/infrared) imagery from the Spinning Enhanced Visible Infra-Red Imager (SEVIRI) mounted on the Meteosat Second Generation (MSG) and from the newly available Flexible Combined Imager (FCI) mounted on the Meteosat Second Generation (MSG) and the Meteosat Third Generation (MTG), respectively, offer the possibility to monitor in near real time (NRT) over the whole Mediterranean area the evolution and organization of clouds around the cyclone’s centre. In fact, the IR measurements reflect the information coming from the top of the clouds. A temporal sampling of 15 and 5 minutes for MSG and MTG, respectively, ensures a continuous monitoring of medicanes and Mediterranean cyclones. At the same time, this high temporal sampling rate allows to track the medicane’s trajectory. Most of the tracking methods available so far are based on output parameters of weather forecast model. Within the MEDICANES project, a deep learning approach (Deep-learning Medicane Tracking Algorithm - DeMeTrA) has been considered to exploit IR data to first identify and, then track a medicane.
DeMeTrA is a Deep Learning model based on VideoMAE Vision Transformer, trained on AirmassRGB image sequences, a known IR composite useful for observing air masses and frontal systems, facilitating the visual identification of cyclone dynamics and atmospheric moisture. The model is first self-supervised trained to learn airmassRGB features and then supervised trained to detect a cyclone observing cloud dynamics in all Mediterranean region. After detection of cyclone presence in a smaller area, the identified area is applied to a next tracking phase, where the same model is trained to output coordinates of a rotating center.
 DeMeTrA examples tracking cyclone center (red dot) in a small area, after detection in the whole Mediterranean Sea.
On the other hand, water vapour channels are useful for the characterisation of the upper-troposphere water vapour field and for tracing stratospheric air intrusions and PV streamers, which are generally associated to cyclogenesis or intensification phases.
Ocean Surface Wind from Scatterometers and Synthetic Aperture Radar (SAR)
Ocean near-surface winds can be obtained both by scatterometers and synthetic aperture radar (SAR). The former benefit from the capacity to estimate both the wind speed and the direction, which makes it a particularly useful source for rotating wind fields encountered in medicanes. This ability to obtain the direction is at the cost of the resolution, which may be too coarse for fine phenomena such as the eye-like center of mature cyclones, convection cells, or for the precise delineation of the frontal structures often seen in well-developed medicanes. These phenomena are better studied with synthetic aperture radars whose resolution can reach the kilometer scale and below but require prior information on the wind direction (despite current studies aiming at reducing this dependency). The high resolution of SAR instruments also enables discrimination between pure wind effects on backscattered signal and contributions of other phenomena such as the sea state or hydrometeors. Scatterometers and SAR are therefore complementary sources for the precise characterization of the wind field.
Satellite scatterometers data are useful to analyze the ocean near-surface wind features with the aim to distinguish between development and mature phases of medicanes. We employed data collected by the ASCAT scatterometer onboard the European MetOp-A, B, C satellites because it is currently one of the scatterometers with the highest spatial resolution (12.5 km). ASCAT data allow to calculate the radius of maximum wind (RMW) as the distance between the rotational center (RC) and the area of maximum winds (AMW). Results show that during the mature phase, a ring-shaped band of strong near-surface winds (encompassing the AMW) encircles a cloud-free eye of quasi-calm winds around the RC. A significant decrease in RMW, often down to a few tens of kilometres, during the mature phase is associated to the cyclone intensification. In order to characterize the surface wind field, we exploited all the available ASCAT overpasses for all the cyclones that occurred in the Mediterranean basin in the time frame 2010-2020. The following images refer to the medicane Numa.
 Example of wind field maps for the medicane Numa. Both development and mature phases are shown (left and right plot, respectively)
The image on the left concerns the development phase, while the one on the right represents the mature phase of the medicane. In both images the blue dot is the minimum of the mean sea level pressure (P), the red dot is the maximum sustained wind (Vmax) belonging within the AMW, and the purple X represents the RC. During the development, the RC is detected within an area of calmer winds in contrast to the position of P which sometimes lies in regions of stronger winds. The AMW is identified at great distance from the RC (up to more than 200 km as in the case of Numa), and it is sometimes associated with frontal activity. In addition, a broad area of weak winds is observed, extending well beyond the immediate surroundings of the RC. In the mature phase, a nearly-closed vortex of strong winds occurs around the RC, and the Vmax is much higher than in the development phase (often exceeding 20 m s-1), denoting an intensification of the cyclone. Moreover, the AMW is more compact within the closed ring of winds, and it is located at closer distance from the RC. It can be noted also that the RC is located within an eye-like feature of relatively calm winds delimited by the closed cyclonic circulation. Conversely, the position of P sometimes falls within the closed loop of strong winds.
Understanding Synthetic Aperture Radar (SAR) Observations of Mediterranean Cyclones
Synthetic Aperture Radar (SAR) instruments are active microwave sensors that emit electromagnetic pulses and measure the backscattered signal from the sea surface. This allows them to detect variations in surface roughness, which can be used to infer wind speed and other oceanic and atmospheric features.
Thanks to the synthetic aperture principle, SAR achieves kilometre-scale and sub-kilometre spatial resolution, making it possible to identify fine-scale structures such as the eye-like center of cyclones, the radius of maximum wind (RMW), and frontal discontinuities—features that cannot be resolved by traditional scatterometers.
Operating at C-band frequencies, as in the case of ESA’s Sentinel-1 satellites, SAR observations are largely unaffected by clouds or light precipitation. This capability enables consistent monitoring under nearly all weather conditions, both day and night. While heavy rain cells can strongly influence the radar signal, their impact is typically localized, allowing them to be detected and masked during surface wind retrievals.
In addition to wind patterns, SAR also reveals backscatter modifications caused by rain and sea-state variations such as swell and wind streaks, offering valuable insight into the interaction between wind, precipitation, waves, and surface roughness.
Dataset and Study Area
SAR acquisitions were selected using the cyclone track climatology developed by Flaounas et al. (2023), which lists Mediterranean cyclones from 1979 to 2020. Additional tracks of medicanes (Mediterranean hurricanes) observed after 2020 were also included.
The final dataset comprises 19 Sentinel-1 scenes, covering well-documented systems such as:All observations come from the Sentinel-1 constellation within the Copernicus Programme, providing 1 km per pixel resolution over 250 km-wide swaths.
Example: Medicane Apollo (October 26, 2021)
The image below illustrates several key structures observed by SAR during Medicane Apollo.
High-Resolution Wind Analysis
A second figure provides a zoomed-in view of Apollo’s rotational center (RC) and the percentile distribution of surface wind speeds averaged with respect to distance from the center. The high spatial resolution of Sentinel-1 enables precise estimation of the maximum wind radius, determined to be 59 km, corresponding to a wind speed of 13.3 m/s after excluding rain-affected pixels.

Other Ocean Products like Sea Surface Temperature, Sea Surface Height, Sea Level Anomaly, Significant Wave Height are part of the survey.
Precipitation Products
Most operational satellite-based precipitation products provided by major space agencies worldwide (such as NASA, NOAA, EUMETSAT, and JAXA) rely on the full spectrum PMW frequencies available from the constellation of radiometers aboard both research and operational LEO satellites. Despite the numerous assumptions required to retrieve precipitation data from spaceborne PMW instruments—particularly over land—significant progress has been made over the past two decades. This progress includes a shift from physically-based Bayesian retrieval methods to more advanced techniques that leverage global observational datasets. These datasets are constructed from coincident measurements between spaceborne cloud and precipitation radars, such as the W-band CloudSat CPR and the Ku- and Ka-band GPM DPR, and PMW radiometers. Additionally, machine learning has increasingly been adopted.
Combining MW-based precipitation estimates with VIS/IR data from geostationary satellites enhances both spatial and temporal resolution. In this project, various PMW and combined MW/IR products will be utilized for precipitation monitoring and for analyzing extreme rainfall events and flooding. Furthermore, Copernicus Sentinel-2 imagery will be considered to detect heavy rainfall at very high spatial resolution.
NOAA CMORPH High Resolution Global Precipitation Estimates: The CPC Morphing technique (CMORPH) satellite precipitation estimates are constructed through integrating Level 2 retrievals of global instantaneous precipitation rates from all available PMW measurements aboard LEO platforms. Then, bias in these integrated precipitation estimates is removed through comparison against CPC daily gauge analysis over land and adjustment against the Global Precipitation Climatology Project (GPCP) merged analysis of pentad precipitation over ocean. The bias-corrected full resolution CMORPH satellite precipitation estimates are created on an 8kmx8km grid over the global domain (60°S-60°N) every 30-minute from Jan. 1, 1998. CMORPH is produced manually once a month at a latency of 3-4 months.
NASA Global Precipitation Measurement (GPM) – IMERG: The Integrated Multi-satellitE Retrievals for GPM (IMERG) algorithm provides multi-satellite precipitation product from various precipitation-relevant satellite PMW sensors comprising the GPM constellation (Huffman et al., 2020). IMERG exploits the 2021 version of the Goddard Profiling (Kummerow et al., 2015) then gridded, intercalibrated to the GPM Combined Radar Radiometer Analysis product (with GPCP climatological calibration), and combined into half-hourly 0.1°×0.1° fields. The IMERG system is run twice in near-real time and it is available as “Early run” ~4 hr latency, “Late run” ~14 hr latency, “Final run” satellite-gauge product ~3.5 months latency. The IMERG dataset (V06B) includes TRMM-era data going back to June 2000.
MSWEP: The Multi-Source Weighted-Ensemble Precipitation (MSWEP) is a global precipitation product with a 3‐hourly 0.1° resolution available from 1979 to ~3 hours from real-time (Beck et al., 2016, 2019). The product merges gauge, satellite, and reanalysis data to obtain the highest quality precipitation estimates at every location. MSWEP incorporates daily gauge observations and accounts for gauge reporting times to reduce temporal mismatches between satellite-reanalysis estimates and gauge observations. Near real-time estimates are available with a latency of ~3 hours. MSWEP tends to exhibit better performance than other precipitation products in both densely gauged and ungauged regions. MSWEP V2.8 features new data sources, improved weight maps, less peaky precipitation estimates, a longer record (1979–2020), near real-time (NRT) estimates.
EUMETSAT H SAF Products: NRT Level 2 PMW precipitation products provide instantaneous surface precipitation rate for all available MW conical (SSMIS, GMI, AMSR2) and cross-track scanning (AMSU/MHS and ATMS) radiometers (latency < 4 hours depending on sensors). The NRT Level 2 PMW products are intercalibrated to generate the Level 3 PMW Precipitation rate at ground on a regular grid at 0.25°x0.25°, every 30 min, with latency 4 hours.
EUMETSAT H SAF - NRT instantaneous precipitation rate at ground by blended MW and IR is available over the full disk area (60°S - 67.5°N, 80°W - 80°E) it is generated by merging Level 2 MW precipitation rates from the PMW radiometer constellation (SSMIS, AMSU/MHS, ATMS, GMI, AMSR2) and IR images from MSG SEVIRI. Hourly and daily accumulated precipitation product (H61) is also available. H SAF precipitation products are routinely validated by an independent product quality assessment team. A Product validation report (PVRs) for each individual product is available on the H SAF website (http://hsaf.eumetsat.int/).
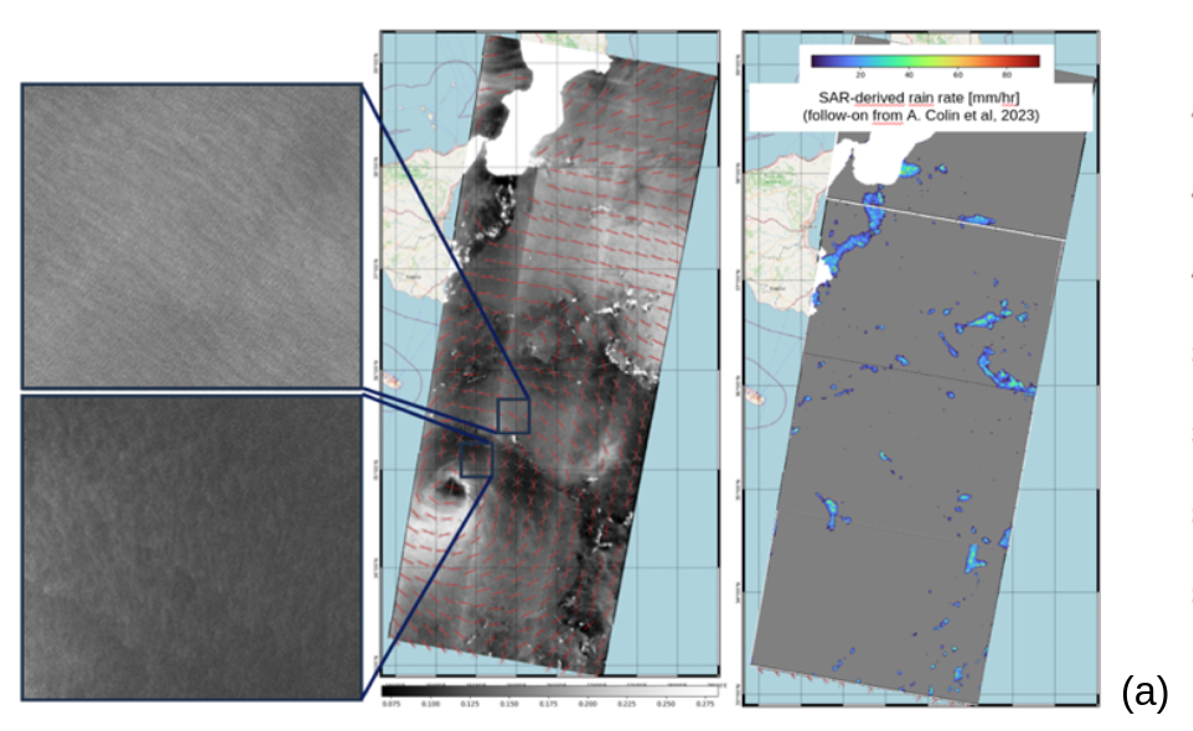
Sentinel-1 Ocean Precipitation Rate (OPR): OPR products are newly introduced sources for estimating precipitation rate. They originate from the processing of Sentinel-1 L1 GRD products and therefore benefit from the high resolution of the SAR, providing estimates at a resolution of 200 m per pixel. OPR products are obtained from a convolutional deep learning model trained on colocalisation between WSR-88D weather radars and Sentinel-1 observations. It has been demonstrated to be particularly efficient to characterize convective precipitations which are particularly at play in medicanes.